When you look at a cryptocurrency price chart, you might see Bitcoin at $60,000 and a new altcoin at $0.02. At first glance, Bitcoin seems way more valuable. But that’s not the full story. A coin priced at $0.02 could have a market cap ten times larger than Bitcoin if it has billions of tokens in circulation. That’s why market capitalization is the real number you need to understand - not just the price per coin.
What Is Crypto Market Capitalization?
Market cap in crypto is the total value of all coins or tokens currently available to the public. It’s calculated by multiplying the current price of one coin by how many coins are actually out there and being traded. This number tells you how big a project is in the market, not just how expensive one coin is.
Think of it like a company’s stock value. If Apple has 16 billion shares and each is worth $180, its market cap is $2.88 trillion. Same idea in crypto - but instead of shares, you’re counting coins. The metric was adopted from traditional finance in the early 2010s as Bitcoin gained traction and new coins started popping up. Today, it’s the go-to number for comparing projects.
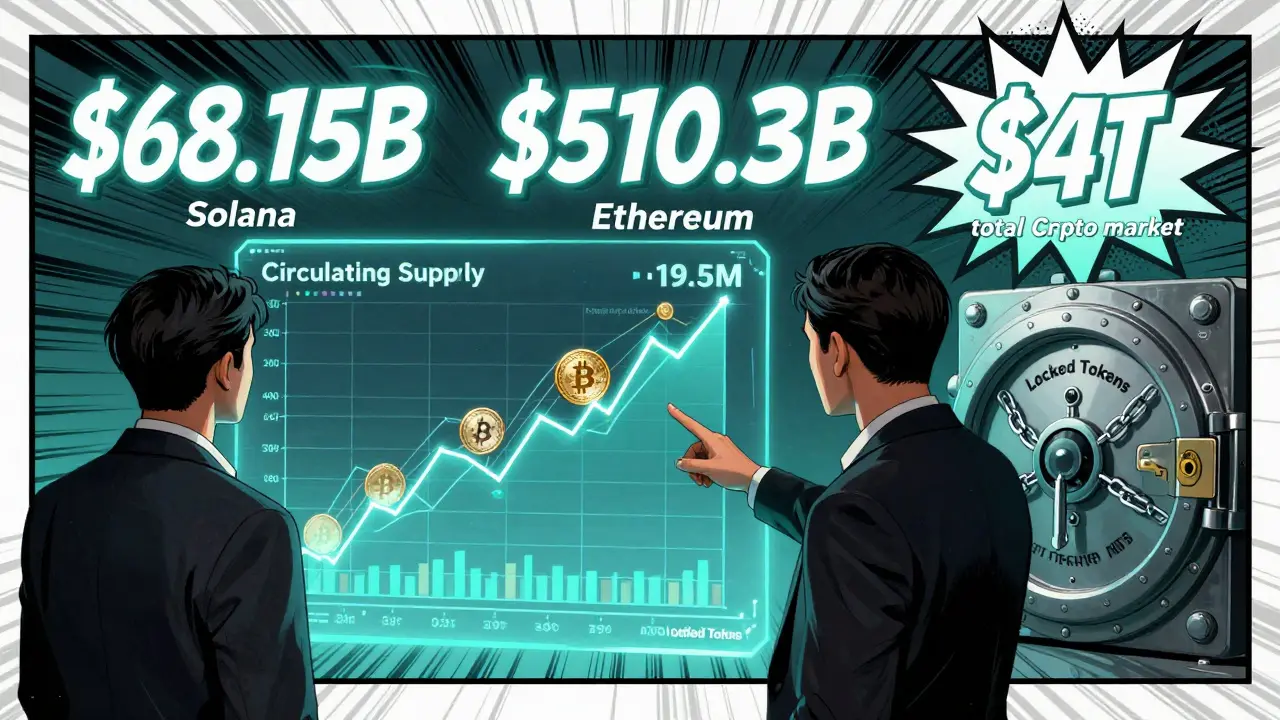
As of December 2025, the entire crypto market hit a record $4 trillion in total market cap. Bitcoin alone accounted for over $2.3 trillion. Ethereum followed at $510.3 billion. These numbers aren’t just for bragging rights - they help you judge whether a project is a giant like Bitcoin or a risky gamble with a tiny user base.
The Simple Formula: Price × Circulating Supply
The calculation is straightforward:
Market Cap = Current Price × Circulating Supply
Let’s break it down.
- Current Price: This is the real-time trading price on major exchanges like Binance, Coinbase, or Kraken. Don’t rely on a single exchange - prices can vary slightly. Use a trusted aggregator like CoinGecko or CoinMarketCap that pulls data from multiple sources.
- Circulating Supply: This is the number of coins that are already mined, issued, and available for trading. It excludes coins that are locked up, reserved for team members, or not yet released. For example, Bitcoin’s circulating supply is around 19.5 million as of early 2026. Not 21 million - because not all have been mined yet.
Here’s a real example:
If Solana (SOL) is trading at $145 and has 470 million coins in circulation:
145 × 470,000,000 = $68.15 billion market cap.
That’s the number you see on CoinGecko. It’s not a guess - it’s based on blockchain data that tracks every transaction and wallet holding.
Why Circulating Supply Matters (And Why It’s Tricky)
Not all coins that exist are in circulation. Some are locked in wallets for years - like tokens reserved for team members, investors, or future development funds. These aren’t part of the circulating supply.
But here’s the problem: different data providers count these differently. One site might include staked coins as circulating. Another might exclude them. That’s why you sometimes see small differences in market cap between CoinMarketCap and CoinGecko for the same coin.
For example, a token might have 1 billion total coins, but 300 million are locked in a vesting schedule over five years. Only the 700 million released so far count toward circulating supply. If a project doesn’t clearly disclose its unlock schedule, the circulating supply number can be misleading.
That’s why experts recommend checking the project’s official blockchain explorer (like Etherscan for Ethereum-based tokens) to verify supply numbers yourself. Don’t trust a single tracking site blindly.
Three Types of Market Cap You Should Know
There are three versions of market cap you’ll come across. Each tells a different story.
1. Circulating Market Cap
This is the standard you see everywhere. It uses only coins currently available to the public. It’s the most accurate reflection of today’s market value. Most investors use this to rank coins and make trading decisions.
2. Total Market Cap
This includes all coins ever created - even the ones locked away forever. It’s rarely used because it overstates value. For example, if a project has 10 billion coins total but only 1 billion are circulating, the total market cap would be 10x higher than the real market value. It’s useful only for understanding how much supply is still coming.
3. Fully Diluted Valuation (FDV)
FDV = Current Price × Maximum Supply
This is the market cap if every coin that will ever exist was already in circulation. It’s a projection, not a current value.
Example: A token has a current price of $0.50, a circulating supply of 200 million, and a max supply of 1 billion. Its circulating market cap is $100 million. Its FDV is $500 million.
Why care? FDV tells you how much value the market could lose if the remaining 800 million coins flood the market. If a project has a high FDV compared to its circulating cap, it’s a red flag - future selling pressure could crash the price.
Professional traders always check both. If a coin has a $500 million circulating cap and a $2 billion FDV, you’re looking at a potential supply bomb.
How Market Cap Helps You Make Better Decisions
Market cap isn’t just a number - it’s a classification tool.
- Large-cap: $10 billion or more (Bitcoin, Ethereum). These are the most stable, liquid, and trusted. They’re less likely to vanish overnight.
- Mid-cap: $1 billion to $10 billion. Higher growth potential but more volatile. Think Solana or Cardano.
- Small-cap: $50 million to $1 billion. High risk, high reward. Many fail. But some become the next big thing.
- Micro-cap: Under $50 million. Extremely risky. Often manipulated. Avoid unless you’re an experienced trader.
According to Messari’s Q3 2025 report, large-cap cryptos have 30-day price volatility around 3.2%. Mid-cap coins? Around 12.7%. That’s a huge difference in risk.
Market cap also helps you spot scams. A token claiming to be the “next Bitcoin” with a $2 million market cap? That’s not a threat - it’s a warning. Real projects with serious backing have market caps in the hundreds of millions or billions.
What Market Cap Doesn’t Tell You
Market cap is powerful - but it’s not perfect.
It doesn’t tell you:
- How much actual usage the network has (are people using it, or just speculating?)
- How much revenue it generates (unlike companies, most blockchains don’t make money)
- Who owns the coins (if 10 wallets hold 70% of supply, it’s not decentralized)
That’s why smart investors pair market cap with other metrics:
- 24-hour trading volume: If market cap is $1 billion but volume is only $5 million, the market is thin. A sudden sell-off could crash the price.
- Active addresses: Are real people using the network? Or is it just bots and whales?
- FDV-to-circulating ratio: Is the market overvalued based on future supply?
As Nic Carter of CoinMetrics put it: “Market cap measures perceived value, not intrinsic value.” You need context.

How to Use Market Cap in Practice
Here’s a simple three-step process:
- Check the source: Go to CoinGecko or CoinMarketCap. Look for the “Circulating Supply” label. Click the info icon - it should explain how they count it.
- Compare FDV: If FDV is more than 3x the circulating cap, be cautious. That’s a sign of future supply pressure.
- Check volume: The 24-hour volume should be at least 1% of the market cap. If it’s less, the market is illiquid.
For example, you find a new DeFi token with a $300 million market cap. Its FDV is $2.1 billion. Volume is $1.2 million. That’s a red flag - high future supply, low liquidity. Walk away.
On the flip side, a token with a $1.2 billion market cap, $1.5 billion FDV, and $200 million daily volume? That’s a healthy, active project.
What the Industry Is Doing About It
Because market cap can be manipulated, the Global Blockchain Council released updated standards in October 2025. Now, all major tracking platforms must clearly state how they calculate circulating supply.
CoinGecko launched “Market Cap 2.0” in November 2025. It now adjusts for locked tokens based on on-chain data and even factors in how many coins are actively being traded versus sitting idle.
Tools like Bitbo.io’s Market Cap Calculator are now industry standards. They let you reverse-calculate: “What price would this coin need to hit to reach a $5 billion market cap?” That’s how professionals stress-test their investments.
Even institutions like Goldman Sachs and Fidelity still rely on market cap as their primary screening tool. Why? Because it’s simple, consistent, and universally understood.
Final Takeaway
Market cap is the most important number in crypto investing. It turns confusing price differences into clear comparisons. A $0.01 coin with a $2 billion market cap is more valuable than a $50 coin with a $100 million market cap.
But don’t stop there. Always pair market cap with FDV, volume, and supply transparency. Use it to filter out scams, not to chase hype. And remember - just because a coin has a high market cap doesn’t mean it’s a good investment. It just means a lot of people believe in it right now.
Learn the math. Verify the numbers. Compare the ratios. That’s how you move from guessing to investing.
 Cryptocurrency Guides
monique mannino
February 14, 2026 AT 17:50Holly Perkins
February 16, 2026 AT 13:18Will Lum
February 18, 2026 AT 05:38Sanchita Nahar
February 20, 2026 AT 04:03Ben Pintilie
February 21, 2026 AT 16:02Sakshi Arora
February 23, 2026 AT 06:23bala murali
February 23, 2026 AT 13:31Ekaterina Sergeevna
February 23, 2026 AT 15:01Desiree Foo
February 25, 2026 AT 04:55SAKTHIVEL A
February 25, 2026 AT 14:15Santosh kumar
February 26, 2026 AT 12:15Claire Sannen
February 27, 2026 AT 06:35Christopher Wardle
February 28, 2026 AT 22:10Joe Osowski
March 2, 2026 AT 01:09John Doyle
March 3, 2026 AT 21:40kelvin joseph-kanyin
March 4, 2026 AT 09:07Elizabeth Choe
March 6, 2026 AT 02:52Crystal McCoun
March 6, 2026 AT 23:40Lindsey Elliott
March 7, 2026 AT 19:50Andrea Atzori
March 8, 2026 AT 02:54Jeremy Lim
March 9, 2026 AT 13:20Elijah Young
March 10, 2026 AT 14:56krista muzer
March 11, 2026 AT 15:54Grace Mugambi
March 13, 2026 AT 06:12Ekaterina Sergeevna
March 13, 2026 AT 22:42